
About Me
I am a results-driven Data Professional with 2 years of hands-on experience transforming complex business challenges into data-driven solutions. With a solid foundation in data modeling, database architecture, and advanced analytics, I specialize in unlocking actionable insights that drive strategic decision-making and operational excellence.
My expertise lies not only in technical execution—using tools like SQL, Python, Power BI, and Excel—but also in aligning analytics with broader business goals. I bridge the gap between raw data and strategic impact, enabling leadership teams to make informed, high-stakes decisions with confidence.
I am passionate about solving real-world problems through data and constantly seek opportunities to innovate, automate, and elevate business processes. As I continue to grow in this field, my mission is to contribute to data-led transformations that deliver measurable results and long-term value.

Core Competencies
Technical expertise that drives business value
Programming Language
Python | OOPs | Numpy | Pandas
Proficient in Python programming with strong object-oriented programming concepts for data analysis and automation.
Business Intelligence Tools
Power BI | Power Query | DAX | MS Excel
Expert in creating interactive dashboards and reports to visualize KPIs and support strategic decision-making.
Database
SQL Server | MySQL Workbench | PostgreSQL
Experienced in designing efficient database schemas and writing optimized queries for data management.
Performance Optimization
Process Improvement | Analytics
Specialized in identifying bottlenecks and implementing data-driven solutions for operational excellence.

Professional Experience
Asharam & Sons Pvt. Ltd. (ARS Group)
Delhi, India
Food & Beverage Ingredients Importer & Distributor
Oct'2025 - Present
Data Analyst | Power BI Developer
- •Designed and developed interactive Power BI dashboards for Inventory, Finance, Sales, and Operations, enabling real-time KPI monitoring and business decision-making.
- •Gathered business requirements from stakeholders and translated them into scalable Business Intelligence (BI) reports and dashboards.
- •Developed and optimized SQL Server stored procedures, views, joins, CTEs, and complex SQL queries for efficient data extraction and transformation.
- •Built and maintained ETL pipelines using incremental data loading techniques to move data from OLTP systems into OLAP reporting databases.
- •Created SQL views for data cleansing, transformation, aggregation, and business rule implementation.
- •Connected Power BI to SQL Server using DirectQuery to deliver near real-time reporting while optimizing dashboard performance.
- •Designed efficient data models, relationships, calculated columns, and developed 50+ DAX measures for KPI tracking and business analytics.
- •Published and managed reports in Power BI Service, including datasets, workspaces, scheduled refresh, user access management, and report distribution.
- •Automated reporting processes using Power BI, SQL Server, Excel, and Google Sheets to improve reporting efficiency and accuracy.
- •Performed data validation, transformation, and quality checks to ensure reliable reporting.
- •Collaborated with Finance, Inventory, Operations, and business stakeholders to translate reporting requirements into analytical solutions.
- •Analyzed large transactional datasets to identify trends, monitor business performance, and generate actionable insights.
- •Worked extensively with Microsoft Dynamics 365 Business Central (ERP) as the primary source for reporting and operational analytics.
Key Business Impact
70%
Reduced manual reporting effort through automation
8+
Enterprise Power BI dashboards built
50+
Reusable DAX measures developed
ETL
SQL-based pipelines with incremental loading
Key Business Project
Customer Payment Delay Analysis Dashboard
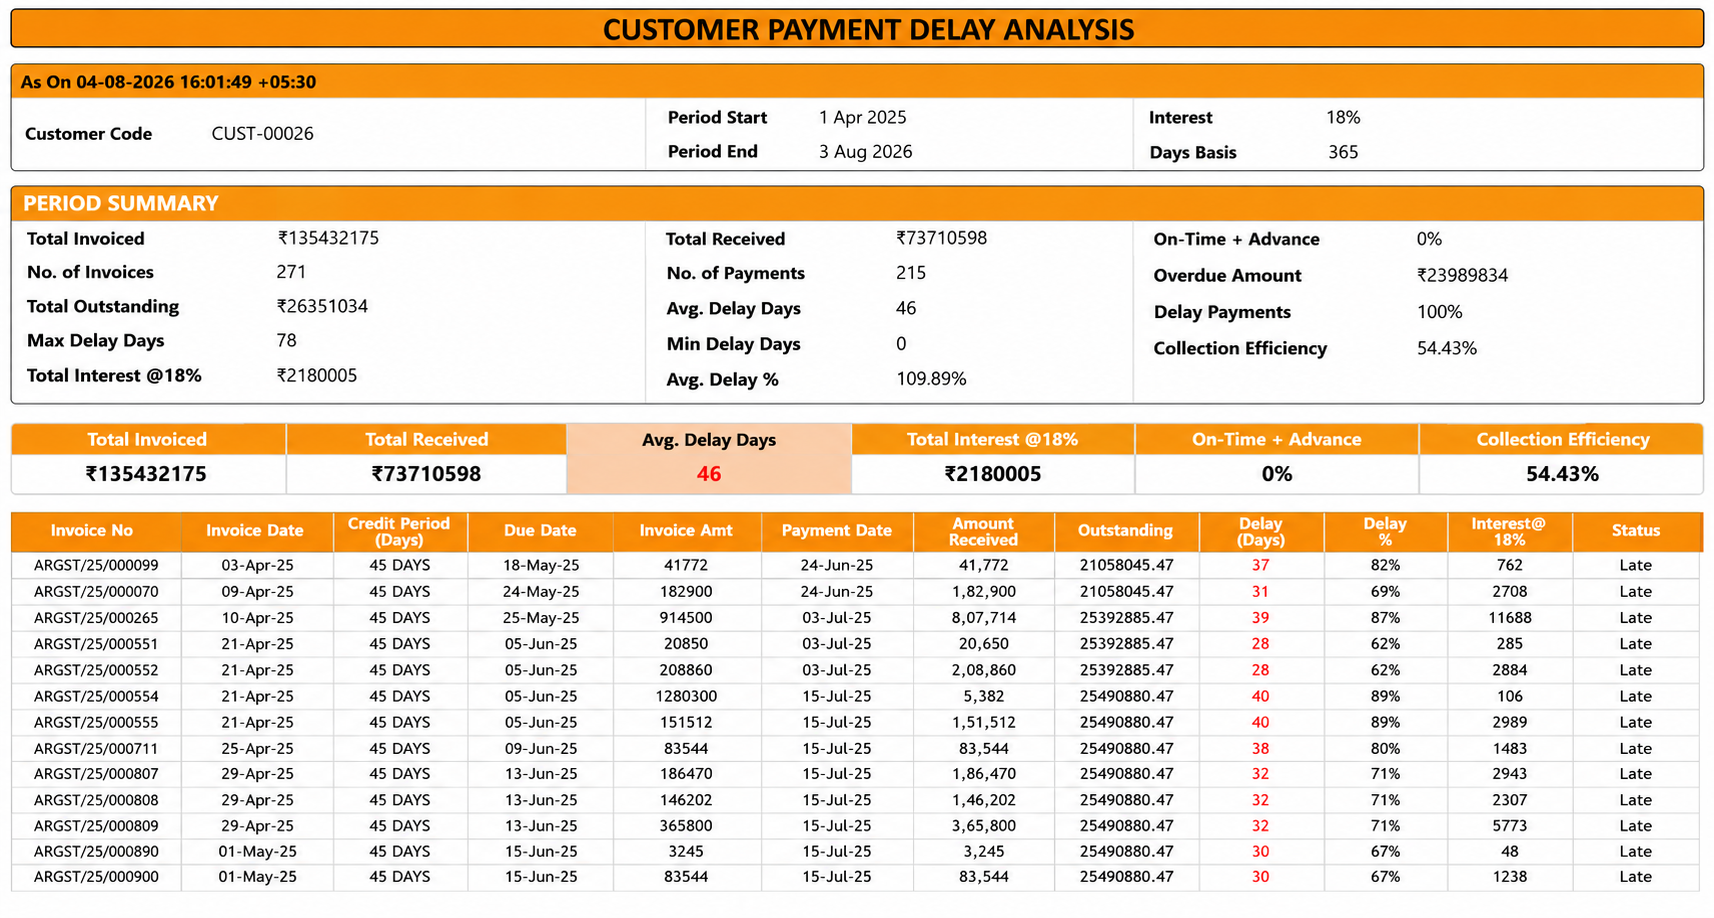
Power BI • SQL Server • Business Analytics
Enterprise Accounts Receivable dashboard for monitoring payment delays, outstanding receivables, collection efficiency, and working capital.
Dashboard Features
Business Impact
Technologies Used
Galaxy Toyota
New Delhi
Leading Automobile Distributor & Toyota Dealership
Jun'2024 - Oct'2025
Business Operations Data Analyst
- •Developed interactive Power BI dashboards and reports to visualize KPIs, leading to a 20% improvement in operational efficiency.
- •Conducted comprehensive data analysis, leading to a 25% improvement in driver utilization rates and a 10% reduction in overtime costs.
- •Identified and streamlined operational processes, decreasing administrative workload by 18% and improving response times by 22%
- •Analyzed and interpreted large datasets using SQL and Python to extract actionable business insights and support strategic decisions.
- •Automated data cleaning and transformation processes using Python (Pandas), reducing manual work by 40%.
Klysta
Delhi
Manufacturing
May'2023 - Jun'2024
Data Analyst
- •Implemented an optimized inventory management system, reducing excess stock by 15% and lowering operational costs by 10%.
- •Automated data collection and cleaning processes using Python, reducing data processing time by 30%.
- •Developed data-driven recommendations that improved operational efficiency and reduced overhead costs.
Vaco Binary Semantic
Gurugram, Haryana
IT Services
Dec'2022 - May'2023
Associate Analyst
- •Analyze and ensure the accuracy of information provided by Google's partners across various platforms.
- •Refine skills in data analysis, problem-solving, and communication to bolster the success of Google's platforms, ensuring the dissemination of accurate information for internal teams and consumers.
Skills & Expertise
Business Intelligence
Power BI Desktop, Power BI Service, DAX, Power Query
Creating interactive dashboards and reports to visualize KPIs and support strategic decision-making.
Database
SQL Server, MySQL
Designing and implementing efficient database schemas, queries, and data management solutions.
Programming
Python
Proficient in Python programming for data analysis, automation, and backend development.
Data Engineering
ETL, OLTP, OLAP, DirectQuery, Data Modeling
Building scalable ETL pipelines, data warehouses, and efficient data models for analytics.
Advanced Excel
Formulas, Pivot Tables, VBA, Data Analysis
Expert-level spreadsheet skills for complex data analysis, modeling, and reporting.
Google Sheets
Data Visualization, Automation, Collaboration
Creating collaborative spreadsheets with advanced formulas and interactive dashboards.
ERP Systems
Microsoft Dynamics 365 Business Central
Working with enterprise resource planning systems for integrated financial and operational reporting.
REST APIs
API Integration, Data Connectivity
Integrating external data sources and services through REST API calls and data connectors.
Data Analytics Workflow
Complete data lifecycle from multiple sources to actionable business insights
Data Sources
Google Sheets
Excel
CSV Files
Oracle DB
IBM DB2
HR Systems
Dropbox
Salesforce
JSON APIs
Cloud Storage
Processing Pipeline
Data Ingestion
Automated collection from multiple sources
Data Validation
Quality checks and error detection
Data Cleaning
Preprocessing and standardization
Data Transformation
ETL processes and feature engineering
Analysis Engine
Statistical analysis and ML algorithms
Insights & Reports
Revenue Dashboard
$3,500
Performance Metrics
85%
Trend Analysis
+15%
Real-time KPIs
Live
Processing Speed
40% Faster
Accuracy Rate
99.5%
Efficiency Gain
25% Better
Automation
85% Automated
Featured Projects

Freight Charge Reconciliation System
Freight Charge Reconciliation System is a comprehensive Data Analysis model designed to verify and reconcile courier charges for an e-commerce company.

📊 Premier League Top Scorers Web Scraping
This project extracts and analyzes the Premier League Top Scorers data from the BBC Sports website using Python and the Beautiful Soup library.

Technical Analysis in Python: SMA, EMA, ADX, Supertrend
📈 Stock Market Analysis with Technical Indicators (SMA, EMA, ADX, Supertrend).

Inventory Optimization System
The Inventory Optimization System is an automated workflow that collects inventory data from Google Sheets, uploads it to a MySQL database, and visualizes the information through an interactive Streamlit dashboard.

🏦 Bank Loan Report – Power BI Dashboard Project
To monitor and assess the bank’s lending activities and overall loan performance by building a comprehensive and interactive Power BI report. The goal is to enable data-driven decision-making by providing real-time insights into critical loan metrics and portfolio health.

Recorded Lecture Insights Dashboard for EdTech Growth Strategy
This project involves end-to-end data analysis and dashboard creation based on collected data from online learning platforms. The primary objective is to uncover meaningful patterns, trends, and recommendations that help the client grow their recorded lecture content offerings effectively.
Interested in seeing more of my work or discussing a potential collaboration?
Data Analytics Services
Transforming data into strategic insights through advanced analytics, visualization, and business intelligence solutions
Data Analysis & Insights
Comprehensive data analysis using Python, SQL, and statistical methods to extract actionable business insights. Specializing in exploratory data analysis, trend identification, and performance metrics evaluation.
Tools & Technologies:
Value Delivered:
Transform raw data into strategic business decisions
Data Visualization & Dashboards
Create compelling interactive dashboards and visualizations using Power BI, Tableau, and Python libraries. Design KPI tracking systems and real-time monitoring solutions for operational excellence.
Tools & Technologies:
Value Delivered:
Make complex data accessible and actionable for stakeholders
Statistical Modeling & Forecasting
Advanced statistical modeling, predictive analytics, and forecasting solutions. Implement machine learning algorithms for trend analysis, demand forecasting, and risk assessment.
Tools & Technologies:
Value Delivered:
Predict future trends and optimize business strategies
Data Cleaning & ETL Processing
Comprehensive data preprocessing, cleaning, and ETL pipeline development. Automate data collection, transformation, and validation processes to ensure data quality and consistency.
Tools & Technologies:
Value Delivered:
Ensure data accuracy and reliability for informed decision-making
Business Intelligence & Reporting
Develop automated reporting systems and business intelligence solutions. Create executive dashboards, performance reports, and data-driven presentations for strategic planning.
Tools & Technologies:
Value Delivered:
Streamline reporting processes and enhance operational visibility
Process Optimization & Analytics
Analyze operational processes to identify inefficiencies and optimization opportunities. Implement data-driven solutions to improve productivity, reduce costs, and enhance performance metrics.
Tools & Technologies:
Value Delivered:
Drive operational excellence through data-driven process improvements
Ready to Transform Your Data?
Let's collaborate to unlock the full potential of your data and drive measurable business results through advanced analytics and insights.
Education
Bachelor's Degree in Mechanical Engineering
University Institute of Engineering and Technology Kanpur Uttar Pradesh
2018 – 2022
Key Achievements:
- •Completed courses focused on skills in Data Science Technology and Mechanical Engineering
- Research Operation | Mathematics | Forecasting Method | Optimisation Technique | Stock Market | Financial Modelling
Get in Touch
Contact Information